
Elliot Manuel Sithole
Data Analyst
Advanced Excel | MySQL | Tableau | Power BI | Python | R
I craft actionable insights for evidence-informed decisions using advanced data analytics tools.
1. Inventory Optimization Project
Excel and Power-BI
I used Excel and Power-BI with Dax functions to review actionable insights for best inventory management practices including;
> ABC Inventory Classification,
> XYZ Classification,
> Inventory Turnover Ratio,
> Calculation of Safety Stock/Buffer Stock & Reorder points,
> Stock Status Classification,
> ABC Pareto Chart & Demand Forecasting.
> Used Excel and Power-BI for:
1. Excel for data manipulation; tidiness and quality improvements
2. Power-BI and Dax functions for data exploration, visualisations and creating a dashboard.
>These helped produce a report with the following deliverables:
1. A clear summary of the findings
2. Documentation of any cleaning or manipulation of data
3. Creation of an Inventory Management Dashboard
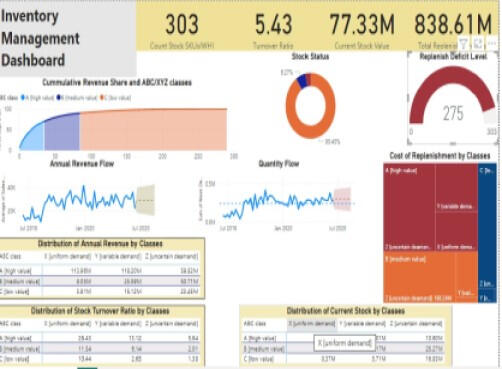
Key Insights
The inventory data analysis was done for the annual period from July 2019 to July 2020, with the forecasting for two months after that period.
• The overall inventory Turnover Ratio was 5.43, meaning roughly 66 days of stock holding over the year.
• Following the ABC and XYZ analysis; the A and X classes of high value and uniform demand stock showed a significant Turnover Ratio of 25.43 against the C&Z, low value and uncertain demand with 1.38.
• The A and X classes as expected produced revenue of 114 million, albeit lower than the A&Y class with 118 million, but overall, the A class products had significant revenue contributions over B and C.
• The difference in revenue between A&X versus A&Y may be explained only due to the contribution of stock volume, which was almost double for A&Y.
• The total stock replenishment cost stood at roughly 840 million against the current stock holding of 77 million. And also, the A class contributes a huge chunk of potential loss in revenue.
• From the stock status, 90.4% are below the re-order point with only 6.3% in stock, which represent a significant potential loss in revenue.
• There is a steady constant revenue flow and quantity flow over the year, which could have been increasing revenue if adequate stocking and prioritization was the inventory strategy in place, hence the company is not realising its revenue potential.
• The 80/20 Pareto rule ABC should be the strategy to prioritize stock. XYZ analysis should also be used to monitor stock demand variability.